x

Quantitative - Mathematics - Data Interpretation:

Bar Charts

MCQ - 39-3933

Question:

The following bar diagram shows the monthly expenditure on food ,clothing, education ,fuel ,house rent and miscellaneous. Study the diagram and answer the questions given below it:

5 -40324924

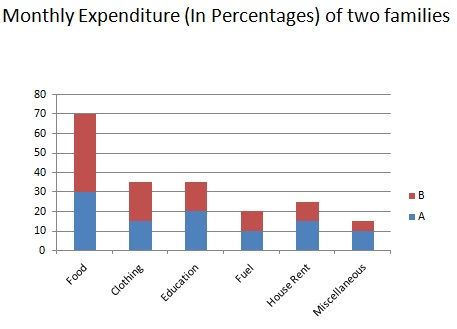
Which of the following fraction represents the spent on education of the total expenditure in family A?

  1. 13 20
  2. 2 3
  3. 9 13
  4. 2 3

Correct Answer: D

Explanation:

Money spent by A on on education= 20% of total expenditure =( 20 100 × total expenditure)= 1 5 of total expenditure

Record Performance

82 MCQ for effective preparation of the test of Bar Charts of Data Interpretation section.

Read the MCQ statement: The following bar diagram shows the monthly expenditure on food ,clothing, education ,fuel ,house rent and miscellaneous. Study the diagram and answer .... nditure in family A?, keenly and apply the method you have learn through the video lessons for Bar Charts to give the answer. Record your answer and check its correct answer and video explanation for MCQ No. 39-3933.

How to Answer

Solve the question for MCQ No. and decide which option (A through D/E) is the best choice to answer the MCQ, then click/tap the blue button to view the correct answer and it explanation.

Share This Page