What Is a Linear Inequality?
A linear inequality is very similar to a linear equation. Recall that a linear equation has variables to the first degree only, and the variables are never squared, cubed, or taken to any other power. Your linear equations might have looked something like these:
x+5=10
2x=4
y=2x+3
3x-3y=1
Linear inequalities look very similar. Instead of equal signs, though, linear inequalities have inequality symbols much like these:
So, linear inequalities only have variables to the first power and have inequality symbols. Now let's learn how to solve linear inequalities.
How to Solve
Think back to when you last solved a linear equation. Do you remember the steps you took? If you were given a problem such as x + 2 = 6, you most likely looked at it and realized that you need to move the number 2 to the other side of the equation so that your variable is alone. So, you proceeded to subtract 2 from both sides of the equation remembering that to keep an equation equal, whatever you do to one side you also must do to the other. After subtracting 2 from both sides, your variable is alone and you have solved the linear equation. Your answer is x = 4.
Now, let's say you are given a problem like x + 2 < 6. You first notice that, instead of an equal sign, you have an inequality sign. This tells you that it is a linear inequality problem. To solve, you use very similar steps to those of solving linear equations. You notice that the 2 is on the same side as your variable. So to move the 2, you subtract it from both sides. The inequality sign remains the same. Your answer is x < 4. To tell someone the answer, you would say: The solutions are all numbers less than 4.
The inequality sign gives you a range of numbers that are all your solutions. To test a solution, plug it into the inequality and, if the statement remains true, the solution is valid. For example, if you plug in a 1 into the statement x < 4, it becomes 1 < 4. You know that 1 is definitely less than 4, so the statement remains true and 1 is a valid solution.
Practice
kkk
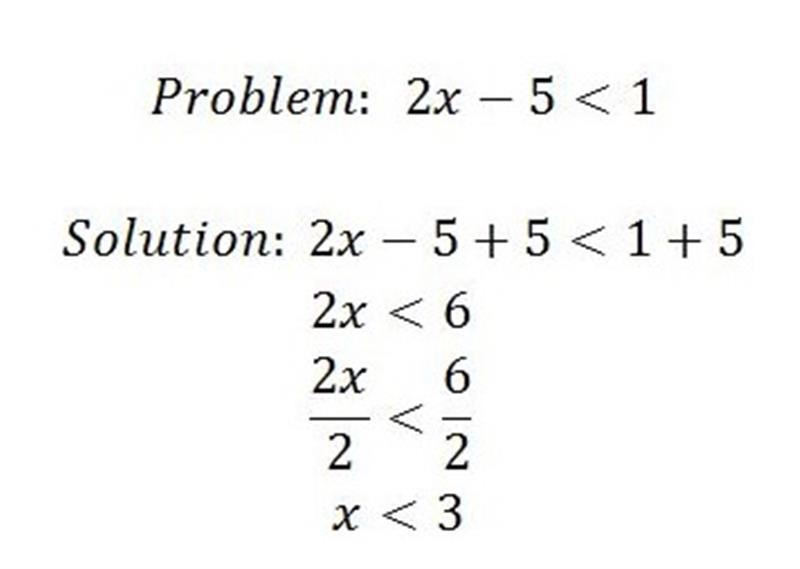
To solve, we must isolate the variable by adding 5 to both sides. Then we divide both sides by 2 so that the variable is by itself. The resulting solution is x < 3, or all numbers less than 3.