I'm a really big fan of trying to teach the 'why' behind the 'how' when it comes to math, and I try to do this as much as I can. Knowing the 'why' can really help cut down on the things you have to memorize and make the work much simpler. But at a certain point you still need to say 'what do I do,' and practice some problems. That's what this lesson is all about. We'll quickly go through four examples so that you can start to get comfortable with the types of questions you might see about inequalities.
I welcome you to pause the video as soon as I introduce any of the four examples and try to do the problem on your own to see how well you do. And then, watch my work to compare how you did with what I did, see if you did it a different way, or maybe, see where your mistake was. By going through the example first, yourself, you can oftentimes cut to the chase on what are the specific things you need verses trying to learn the whole thing when maybe you already know most of it.
Practice Problem No 1
Solution for problem No 1
Here we go. Our first example:
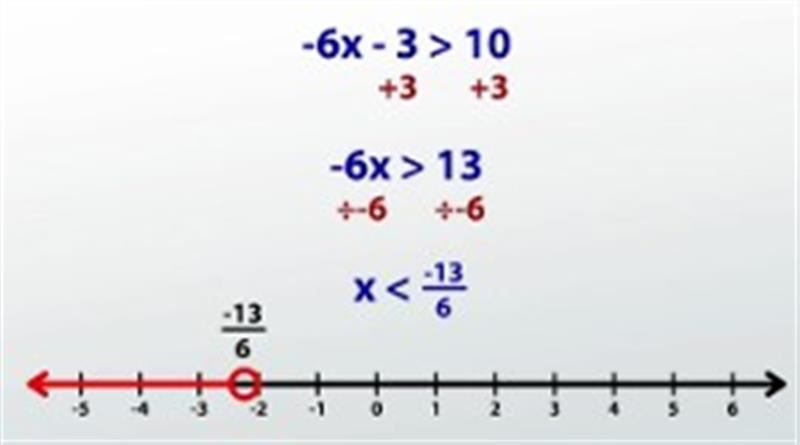
Solve and graph the inequality -6x - 3 > 10
This is a 1-variable inequality because there is only one letter x, and it is not a compound inequality because there is only one greater than or less than symbol. This means we can simply use inverse operations to get the x by itself and do our graph when we're done.
I can begin by taking off the outer most layer -3 with a +3. Now the outermost layer is times by -6. I undo multiplication with division. Dividing both sides by -6 gives me a fraction on the right-hand side, which is okay: -13/6. I now must also remember the golden rule about inequalities that is we must flip the inequality symbol when we divide or multiple both sides by a negative number. Therefore, the solved inequality I get is x < - 13/6.
Now we're ready to graph. Because this is a 1-variable inequality, I put my graph on a number line. I find my way over to -13/6, which is about -2.17. I put an open circle there - I don't fill it in - because it is just less than, not or equal to. I draw an arrow going to the left to indicate all the numbers that are smaller than this are allowed.
Practice Problem No 2
On to example two:
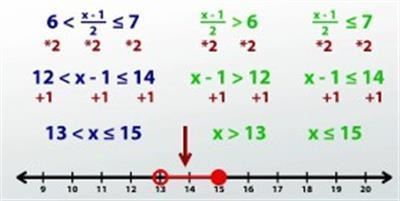
Solve and graph the inequality 6 < (x - 1) / 2 <_ 7
We've got another 1-variable inequality here, but it is now a compound inequality because there are two greater than or less than symbols. This example is an AND compound inequality because the variable is sandwiched in between two values, which tells me that my answer, my graph, should look something like this. We will still use inverse operations to get the x by itself, but because there are two inequality symbols, we'll have to do two problems in one.
Solution for problem No 2
There are two methods to do this. So, it can get confusing to do two problems in one. So, there are two methods to do this. In one we split the inequality up into two separate inequalities and solve each individually. In one that's going to be a little bit faster where we leave it as a compound inequality and do both problems at once. I'll show both ways (one on one side and one on the other), and you can decide which you like more.
It's up to us to get the x by itself. I have to use inverse operations to undo whatever's being done. Looking at the expression with the x in it, the most outside layer is divide by 2, which means I have to multiply by 2 to undo that. In the long way, where we split it up, I can simply multiple by 2 on both sides in both inequalities. You end up with this. But you see on the method where I'm doing both sides at once, I can express all that in one line, and I end up with a very similar statement. Now the only operation to undo is -1. I undo subtraction with addition. I add 1 to both sides, and no matter which method you are using, you end up with 13 < x <_ 15.
Now that we've solved the compound inequality, we can graph it by doing one piece at a time. I can start by putting x > 13 on the graph by putting an open circle at 13 because it's just greater than not equal to and drawing an arrow to the right to indicate all the values that are bigger. I can put x >_ 15 by putting a closed circle, a filled-in circle, at 15 to indicate that it could be or equal to and an arrow going to the left to indicate that it's all the values that are smaller than that. Because this is an AND inequality, I need both things to be true, which means the only solutions are the ones where both graphs are, where they overlap.