Slope Basics & Review
In this lesson, you'll take a look at some oddball slopes. But first, let's review the basics. Slope is the amount of vertical change per unit of horizontal change. In other words, as a line moves one unit to the right, how many units does it go up or down?
You learned in another lesson that if a line goes up from left to right, its slope is positive, and if it goes down from left to right, its slope is negative. You also know how to identify whether the slope is positive or negative when the line is written in y = mx + b form. M represents the slope of the line, so if m is positive, the slope is positive, and the line will be slanting upwards. If m is negative, the slope is negative, and the line will be slanting downwards.
But what if you get one of these?
In this lesson, you'll learn how to deal with both of those cases. They might look tricky when you first start out, but they're not actually that bad once you get to know them - in fact, they're some of the easiest slopes to handle!
Undefined Slope
First, we'll start with this one.
kkk
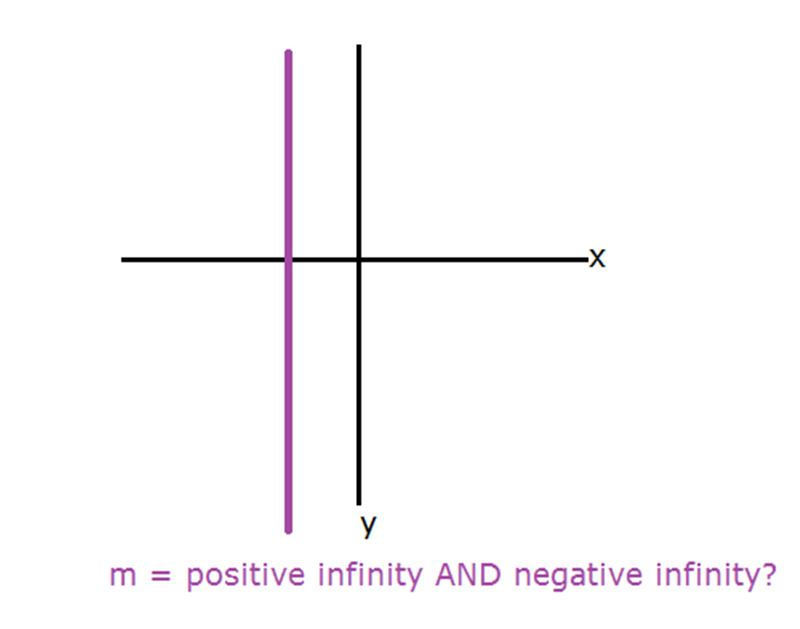
If the line is vertical, it means that the slope is undefined: it has no value that we can express in numbers. That's a pretty crazy concept, so let's take a look at what's going on here. You know that as a line gets steeper and steeper, the slope gets bigger and bigger if it's positive, or smaller and smaller if it's negative. In both cases, the absolute value of the slope increases as it gets steeper.
The bigger a number gets, the steeper the slope is. But the problem with numbers is that they can just keep getting bigger and bigger. There's no such thing as the biggest number. So, no matter how steep the slope is, there will always be a slope that's even steeper. You can just add or subtract 1.
To get a completely vertical slope, you'd have to have a number that was simultaneously the biggest and the smallest number in existence, but that's not possible. Neither of those numbers exist, and they certainly can't be the same number. That's why the slope is undefined. Mathematically, the slope isn't actually a real number; hence we call it undefined.
So if m is undefined, how do we write this line as an equation? If you look more closely at the graph, you'll see that the x-value is exactly the same for the entire line. So to represent this line numerically, we use the equation x = . The line here is the line x = -2. The x-value is the same for every value of y: it's always -2.