Increasing or Decreasing
Next, let's look at increasing or decreasing. Maybe your waistline is increasing as the bacon on your plate is decreasing.
To be increasing, a function's y value is increasing as its x value increases. In other words, if when x1 < x2, then f(x1) < f(x2), the function is increasing.
To be decreasing, the opposite is true - a function's y value is decreasing as its x value increases. In other words, if when x1 < x2, then f(x1) > f(x2), the function is decreasing.
An increasing function looks like this:
Graph of increasing function
Here, when x is 0, y is -1. When x is 5, y is about 1. As x goes up, so does y. That's increasing.
Decreasing looks like this:
Graph of decreasing function
Here, the y values are getting smaller as the x values increase. When you have a graph like the one above, just think of increasing and decreasing as going up or down from left to right. If a line rises, it's increasing. If it falls, it's decreasing. You could also think of slope. A positive slope is increasing, while a negative slope is decreasing.
In a nonlinear function like this:
This nonlinear function is both increasing and decreasing.
It's both increasing and decreasing. This one is increasing until x = 0 and decreasing when x is greater than 0.
If you were asked when this function is increasing, you'd say when x < 0.
Positive or Negative
Finally, let's look at positive or negative. As in, my dog has a positive outlook about everything, especially if it involves going for walks or smelling other dogs. Meanwhile, my cats have a negative outlook about things, especially things involving my dog.
A function is positive when the y values are greater than 0 and negative when the y values are less than zero.
Here's the graph of a function:
This graph is positive when x is less than 2 and negative when x is greater than 2.
Where is it positive? When x < 2. And, it's negative when x > 2.
Here's another:
kkk
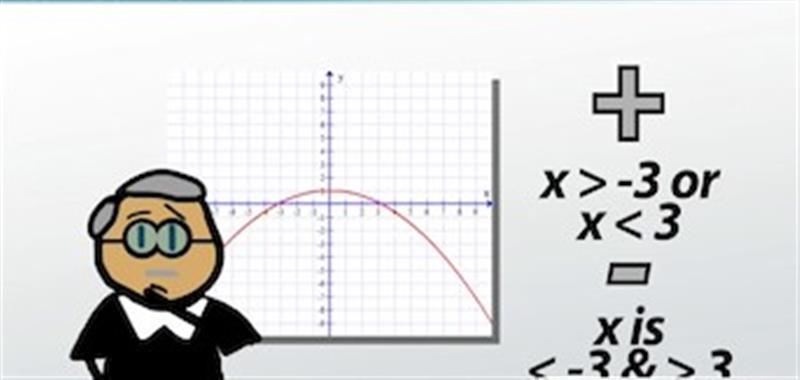
This graph is positive when x is greater than -3 and negative when x is less than -3 and greater than 3.
This one is positive when x > -3 or x < 3. It's negative when x is < -3 and > 3.
Of course, you can do this without the graph. Let's consider f(x) = x^2 + 3x - 2. Is it positive or negative when x = -1? Just plug in -1 for x. So, f(x) = (-1)^2 + 3(-1) - 2. That's 1 - 3 - 2, or -4. -4 is negative, so f(x) is negative when x = -1.
What about when x = 3? So, f(x) = (3)^2 + 3(3) - 2, which is 9 + 9 - 2, or 16. 16 is positive, so f(x) is positive when x = 3.