x
GMAT
Select Test Select Question Types

GMAT: What is a Number Line
Plotting Points on The Coordinate Plane

If you'll be working with a graph, otherwise known as the coordinate plane, it's essential to understand how it works. This includes learning the parts of a graph, identifying points and plotting points.Descartes and Cartesian Coordinates.Once upon a time, I lived in rural Maine. I sometimes had to ask locals for directions.

Plotting Points on The Coordinate Plane

Descartes and Cartesian Coordinates

Once upon a time, I lived in rural Maine. I sometimes had to ask locals for directions. In rural Maine, the windy, confusing roads aren't always marked well, if it all. And people had a habit of saying things like, 'Turn left where the Paxtons' barn used to be,' or 'Turn right after the field where they were gonna build that corner store.' Not helpful.

Way back in the 17th century, French philosopher and mathematician Rene Descartes had a similar problem. You might remember him as the guy who said, 'I think, therefore I am.' He was never lost in Maine, but he was trying to make geometry easier. There's a story, and it may or may not be true, that Descartes was sick in bed one day when he noticed a fly on the ceiling. He realized he could describe its position based on the grid of ceiling tiles. Maybe it was five tiles in from the east wall and four tiles from the south wall.

And, if that story's true, the concept of the Cartesian coordinate plane was born. Named for Descartes (though less French-sounding), Cartesian coordinates are a method of identifying a point on a graph relative to a set of lines. You might hear this referred to with or without the word 'Cartesian' on it. Don't worry, it's still the same thing.

Parts of a Graph

Before we get to identifying and plotting points, let's look at the parts of a graph. The most common version of the coordinate plane looks like this. Basically, you have a grid. On that grid, there are two lines. The x-axis is the horizontal line on a graph. Remember, x is a cross, so it goes 'across' the graph. The y-axis is the vertical line on a graph. You can see that that the letter Y is reaching for the sky - so 'Y to the sky.'

Ex1
Ex
X and Y Axis

The axes meet at the origin. Everything begins at the origin, even graphs. Both axes are at 0 here. The x-axis is positive to the right and negative to the left. That's exactly like a number line. In fact, that's really all an x-axis is. But when it gets together with its friend the y-axis, it becomes a graph. The y-axis is positive going up and negative going down.

As you can see, the axes break up the graph. The four sections of the graph are called quadrants. They're numbered with Roman numerals. To remember which quadrant is which, think positive. Quadrant I is here, where both the axes are positive. Then it just goes counterclockwise through Quadrant II, Quadrant III and Quadrant IV.

kkkEx1
Quadrants Numbered Counterclockwise

Why counterclockwise? Blame the Babylonians. No, really. The ancient Babylonians measured angles in that direction, and today, mathematicians think that that was passed on to graphs. Think of it this way: You have to go back in time to find the answer, which is counterclockwise on a clock.

Identifying Points

Okay, enough with time travel. Let's get to identifying some points. If you look at this grid, it looks just like those ceiling tiles in Descartes' bedroom. Well, I think it does. I've never been to his house.

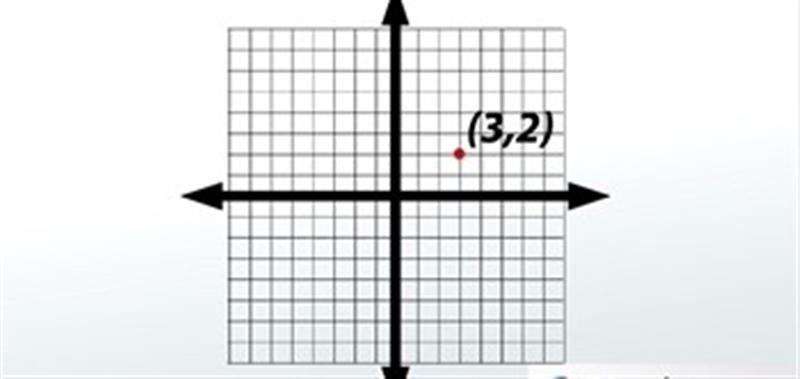
If you want to identify a point, like this one, start at the origin. Always start at the origin. First, we count along the x-axis. Why? Because x comes before y. This point is 1, 2, 3 to the right.Now we count up. It's 1, 2 up. We would write this point as (3, 2). That right there? That's called an ordered pair. An ordered pair is just a pair of numbers in order, indicating a point on a graph. X is first, then y.

Ex2
Ex2
Ordered Pair (3, 2)

Here's another one. This one is in Quadrant II. Remember, Quadrant I is all positive, then we go counterclockwise to Quadrant II. This one is -1, -2, then 1, 2, 3, 4. So it's (-2, 4). Let's try Quadrant III. -1, -2, -3, -4, then -1, -2, -3. So it's (-4, -3). Why so negative, Quadrant III? Okay, let's complete the circle with a point in Quadrant IV. Remember, we're now in positive territory with the x-axis. 1, 2, 3, 4, 5. Then -1, -2. So it's (5, -2).

Plotting Points

Plotting points is the exact same thing as identifying points, only in reverse. Where would (-2, 4) be? Remember, x before y. -1, -2. Then 1, 2, 3, 4. Right here. What quadrant is that? Quadrant II.

kkkEx2
Plotted Point (-2, 4)

What about (-3, -3)? -1, -2, -3. And -1, -2, -3. That's in Quadrant III. Here's another one: (2, 5). That's all positive, so it'll be in Quadrant I. We go 1, 2. Then 1, 2, 3, 4, 5. And we did it!

Share This Page


Trending Fashions

Explore the novel trends in fashion in your region

Trending Fashion
Entertainment

Entertainment in your busy life not far away

Entertainment in Busy Life
Yoga and Health

Yoga helps keep you away from ailments

Healthful Yoga
Win Interviews

Learn how to win Interviews to have job

Win Interview for Job