What is a Grid?
You've probably used grids before in real life. For example, a chessboard is a grid. Along the bottom, there are columns labeled A through H, and along the side, there are rows labeled 1 through 8. If you want to talk about a specific square on the board, you can refer to it by its number and letter. For example, the pawn here is at B3.
The type of grid used in math problems is called the Cartesian plane or xy plane. A Cartesian plane is a little different from a chessboard, but you can think about it the same way. Using a Cartesian plane can help you solve all kinds of math problems and understand the relationships between things in the real world.
In this lesson, you'll learn about the parts of a Cartesian plane, so you'll be all ready to use it when you need to.
X & Y Axes
On a chessboard, the horizontal location of a piece is labeled with a letter and the vertical location is labeled with a number. On the Cartesian plane, it's a little bit different: both the horizontal and vertical position are labeled with numbers. On a Cartesian plane, you can also have locations that are described with negative numbers.
The numbers that describe a particular location on the Cartesian plane are called coordinates. The x-coordinate of an object on the Cartesian plane tells you how left or right it is from the center of the graph. Every graph has a line called the x-axis, which marks the horizontal location of points on the graph. This is basically a number line, and if you've used number lines before, it should look very familiar.
If you're moving to the left along the x-axis, the number will be negative, and if you're moving to the right, it will be positive. For example, the x-coordinate of this point is 5, because it's 5 units to the right of the center of the graph. The x-coordinate of this point is -5, because it's 5 units to the left of center.
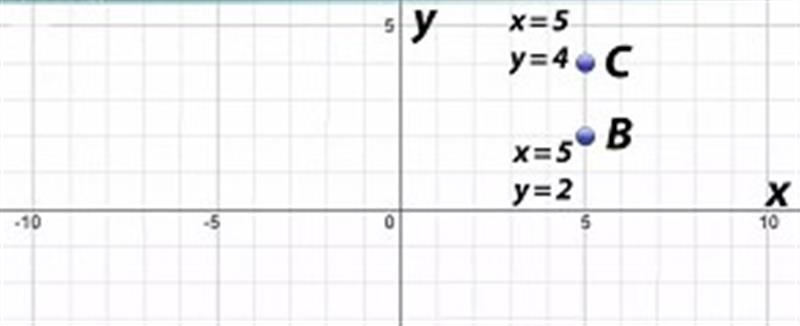
Using x-coordinates lets you distinguish between points: for example, Point A in this graph has an x-coordinate of 3, and Point B has an x-coordinate of 5. But how would you distinguish between Point B and Point C? They're obviously not in the same place, but they both have the same x-coordinate!
That's where the y-coordinates come in. The line that shows the vertical position of points on the graph is called the y-axis. The y-coordinate of an object tells you how far up or down it is on the y-axis, relative to the center of the graph. You can remember which axis is x and which is y by looking at the letters: the letter y has a long tail that goes down, so the y-axis is the axis that goes up and down.
Looking at the y-coordinates lets us describe the differences between these two points. Point B has an x-coordinate of 5 and a y-coordinate of 2. Point C has an x-coordinate of 5 and a y-coordinate of 4.
kkk