What Is a Quantitative Variable?
A quantitative variable is something that can be measured and written out as a number. For example, age, height, and life expectancy are all quantitative variables because all of these can be written as a number. If you asked someone to give you their age, they would give you a number. It's the same with the others.
You will see quantitative variables used in surveys. When you have more than one quantitative variable in a survey, relationships between the various variables can be seen. But, why is this important? Why is it helpful to describe the relationships between quantitative variables?
Why Describe Relationships?
Many times, one variable is related to another. Knowing how one variable relates to another gives you valuable information you can use. For example, the two quantitative variables age and height are related to each other. We know that as children age, they also grow taller. We can do surveys on different populations to find out each group's average age-to-height information.
Knowing this can help us. For example, if we are a doctor and we meet a child who happens to be much taller than expected for his age, based on the information we have, we can then proceed to inform his parents and figure out why he is much taller. There could be a medical condition that is causing it. And, if there is, he needs to be treated for it before it causes him damage. If we didn't have our information about the relationship between age and height, then we wouldn't be able to provide this level of help to that child. Knowing how one variable relates to another is important, and it can even save lives.
Let's see how we can come up with a relationship on our own given two quantitative variables and some data collected from a survey.
Two Quantitative Variables
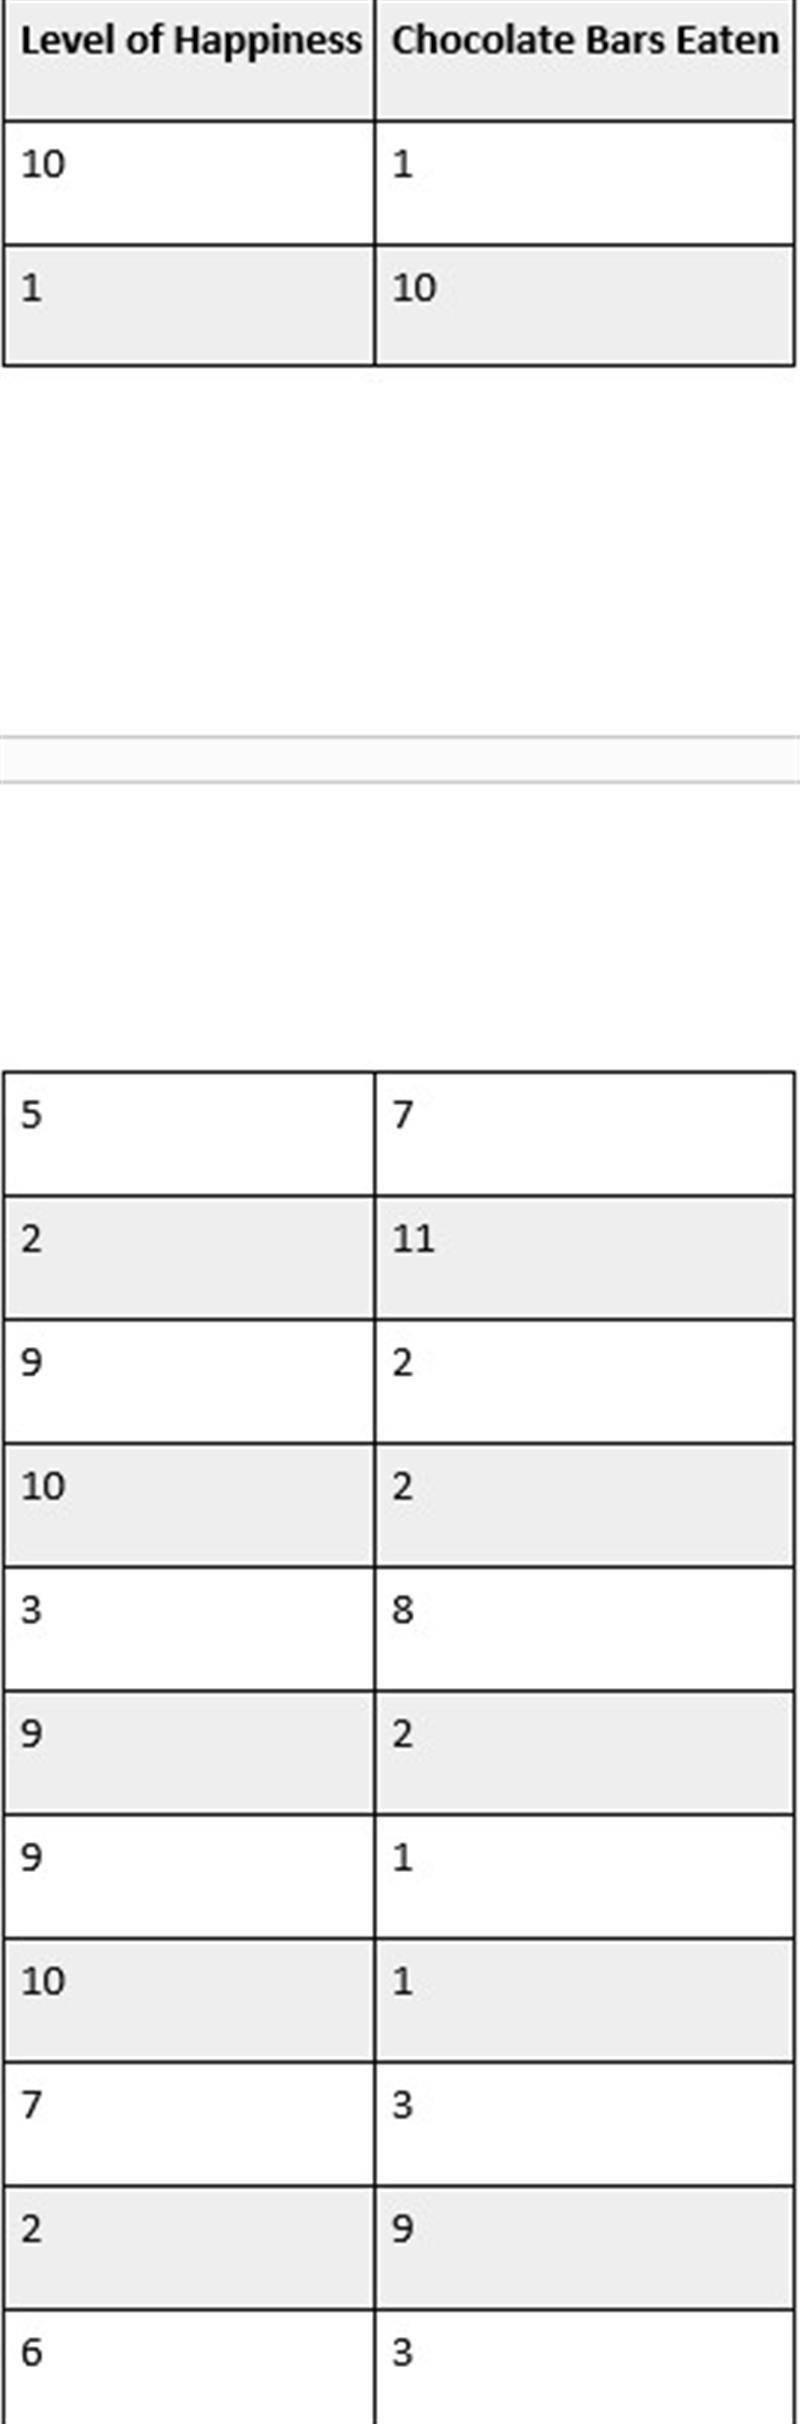
Our two quantitative variables are level of happiness on a scale of 1 to 10, with 10 being the highest level of happiness, and the number of chocolate bars eaten. Both of these are quantitative variables because each is represented by numbers.
We take our little survey to the really nice chocolate bar store at the mall, and we start asking people to rate their level of happiness as they keep eating chocolate bars. We were able to survey 20 people and this is their data:
kkk