What is a Histogram?
In math, a histogram is a visual way to display frequency data using bars. A feature of histograms is that they show the frequency of continuous data, such as the number of trees at various heights from 3 feet to 8 feet. They are not used to show categorical data, such as the population of dogs in Norway, Finland, and Sweden. Another feature of histograms is that the data can be grouped into ranges. For example, the height of the trees can be grouped into 3 to 4 feet, 5 to 6 feet, and 7 to 8 feet.
When to Use a Histogram
How do you know when to use a histogram? You can decide this by looking at your data. Ask yourself, 'Is the data continuous, or can I group the data into ranges?'
What you are looking for is a group of data that is continuous. What this means is that the data covers a range of values that does not jump. For example, the range of tree heights is 3 to 8 feet. The data does not jump from 4 to 6 feet. There is no gap. The countries of Norway, Finland, and Sweden, though, do jump. There is no continuity between the countries. They are separate entities. For histograms, you need continuous information and not just categories that jump.
Histograms are great at showing results, such as the frequency of the number of trees at various heights from 3 to 8 feet. So, if you have a set of continuous data, then you can use a histogram to show the results visually.
So, let's say that I surveyed a hill by my house, and I counted the number of trees at various heights. I found that at 3 feet, my hill only had 2 trees. At 4 feet, my hill had 4 trees. At 5 feet, I only had 1 tree. At 6 feet, I had 7 trees. At 7 feet, it was 8 trees. Then at 8 feet, I had 2 trees. The histogram for this information would have the x-axis showing the range of heights from 3 to 8 feet. Then, the y-axis would have the number of trees.
Then, I have several options for showing the data. I can show the data for each height separately, or I can group them into ranges, such as 3 to 4 feet, 5 to 6 feet, and then 7 to 8 feet.
There are different options for showing data on a histogram.
I can combine the data into any number of different ranges. I can also group them into ranges, such as 3 to 5 feet and 6 to 8 feet. It is your choice based on the kind of information you want to show. If you want to be specific, then use smaller ranges or don't use ranges at all. If you want to be more general with your data and just show an overview, then you can use larger ranges to group your data.
To create the histogram below, what I have done for every tree measured is increase that tree height's bar on the histogram by 1. So, if my tree measures 3 feet, then I increase the bar for 3 feet by 1. After measuring 2 trees that are both 3 feet high, my bar at 3 feet should be at the number 2, since there are 2 trees that are 3 feet high. I continue doing this until I have all of my data on the histogram.
kkk
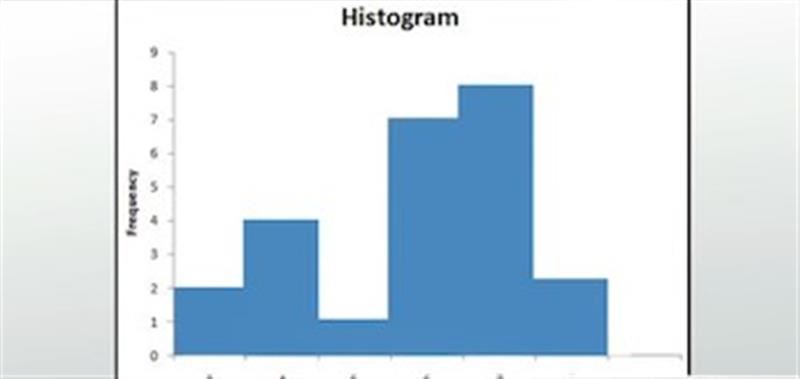
Histogram showing tree height data.