Z tests and Drive Thrus
Fast food chain Speedy Burger claims their customers can expect to complete a drive-thru order, from the time they place the order until they receive their food, in 90 seconds with a standard deviation of 5 seconds. This means that the average customer can expect to get a delicious meal in about a minute and a half. Chill Hot Dog, a competing fast-food company, wants to disprove this claim, so they send some spies with stop-watches to time a random sample of 50 customers ordering through Speedy Burger's drive-thru. Through the observations, they find that the mean time to receive a completed order is 102 seconds. Is this enough evidence to contradict Speedy Burger's claim? To find out, a z-test can be conducted.
Z tests are very useful calculations when comparing sample and population means to determine if there is a statistically significant difference. After all, the difference between the sample and population means may be due to random chance. These calculations can be used to prove or disprove claims or hypotheses. They require a random sample from a population that is normally distributed and has a known mean (average). Z-tests are most useful in large populations, where the sample size is greater than 30. Let's learn more about these useful statistical methods and the formulas to use.
Different Types
There are a variety of z-tests that can be used for different purposes, but two of the most common are the one-sample z-test and the two-sample z-test. As their names suggest, the one-sample z-test compares the mean for one sample and the two-sample z-test compares two. Z-tests are used mainly when there are larger samples (n>30), but no matter which z-test is used, they all require data with a normal distribution, which means that the data is distributed evenly around the mean.
One-Sample Z-Test Formula
Let's explore an instance where a z-test could be used to try to disprove a claim. Remember Speedy Burger's drive-thru timing claim? They have decided to prove to Chill Hot Dog, once and for all, that no matter what their spies reported back, Speedy Burger's 90 second claim is true. To do so, they perform a few z-test calculations.
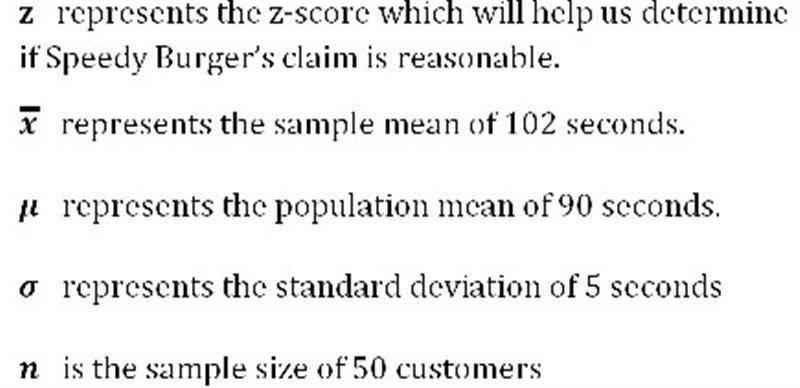
Since they will be comparing their existing data for the drive-thru timing with that of the random sample of customers that their competitors observed, they should use the one-sample z-test. The formula is:
Where:
kkk
Substituting the data into the formula yields a z-score, called a critical value. The z-score is the value we look at to determine whether the hypothesis is correct. The z-score here is found to be 16.97. What does this z-score mean? It means that the particular sample is 16.97 standard deviations above the mean, meaning that for these particular samples, on average, have values that are above the standard mean. For Speedy Burger, it means that, on average, they don't meet the 90 second claim. If the z-score was low enough, even if it was above the standard mean, it would still mean that Speedy Burger does meet the 90 second claim. But, unfortunately, Speedy Burger's z-score is much higher.