Statistical Analysis
In this modern world, we are surrounded by data everywhere-- be it our shopping behavior, eating habits, sleeping patterns, education, or jobs. Data can be captured from almost anything. So how are these data used and what do they tell us? The data in itself does not tell much. In order to get meaningful information out of the data, certain analysis needs to be carried out on the data.
The science of analyzing large amounts of data to explore the underlying patterns, trends and hidden insights from them is called statistical analysis.
Types of Statistical Analysis
- Descriptive analysis helps in summarizing the available data. It analyzes the structure and distribution of either the entire data. This analysis generates limited insights that only presents a way to summarize the data.
- Inferential analysis is used to deduce some insights from the data that are not apparently visible. It can be used to make judgements and infer insights from the data.
Now, we will look at the various types of analysis within each of these categories with the help of an example. Let's say Marie is a math teacher and teaches a class of 50 students. She wants to analyze the test scores of her students. We'll see what types of statistical analysis techniques she can use.
Measures of Central Tendency
These are a type of descriptive analysis that are used to represent the central cluster (or typical scenario) depicted by the data. The most commonly used measures here are:
Median is calculated by arranging the data points in ascending order and then taking the middle number. In case of two middle numbers, their average is taken. For a set of n data points,
In our example, if Marie finds out that the median test score in the class is 60, it means that half of the students scored higher than 60 and half scored below 60.
Mean represents the average of the data points. It is calculated by dividing the sum of all the data points by the number of data points.
Mode represents the most frequently occurring data point in the sample of data.
In our example, Marie finds out that four students scored a perfect 100, and this was the most frequently occurring score. In such a case, 100 would be the mode.
Measures of Dispersion
These are a type of descriptive analysis that are used to explain how spread out the data points are. The most commonly used measure is standard deviation.
Standard deviation is calculated by taking the difference of each data point from the mean of the data, squaring them, adding them up, dividing the sum by the number of data points and then taking the square root. If that sounds like a headache to calculate, one can use computer software to calculate the standard deviation. With big data sets, statisticians have no other choice.
Standard deviation is very useful in a normal distribution. A normal distribution is a variable that is distributed evenly about a mean. It is usually bell-shaped, and symmetrical about the mean.
In a normal distribution, approximately two-third of the data points lie between one standard deviation above and below the mean.
kkk
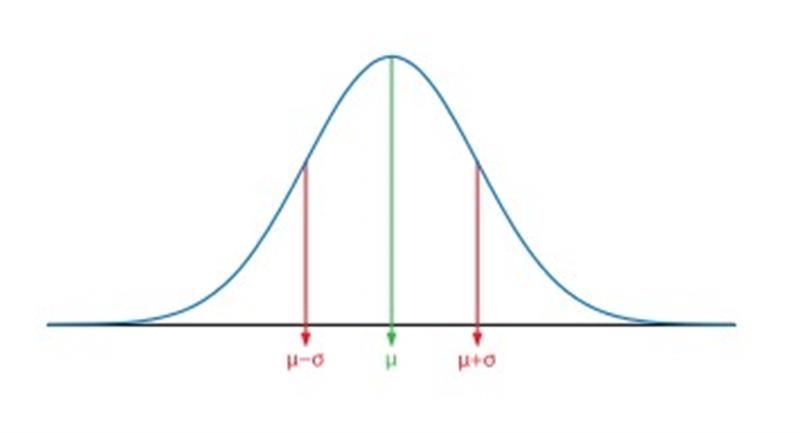
Approximately 2/3 of all data are within one standard deviation above and below the mean in a normal distribution.
For example, if the scores in Marie's class are normally distributed, the mean score is 55 and the standard deviation is 15, then two-third of the students have scored between 40 and 70.