The Steps
In this lesson, we'll talk about finding the equation of a trend line. In the real world, your data will usually be scattered like in this graph instead of lining up neatly in a straight line.
In some real world cases though, your data will look like it follows a line. If it does, then you'll be able to approximate your data with a line and a linear equation. This line that you approximate your data with is called the trend line. If this line is a straight line, then you'll be able to find an equation for this line.
In this lesson, we'll talk about finding an equation for trend lines that are straight lines. For these types of trend lines, you'll be able to find an equation in the slope-intercept form where m is your slope and b is your y-intercept. Remember, your slope is how steep your line is. A flat horizontal line has a slope of 0. A diagonal line on the graph has a slope of 1. Steeper lines have larger slopes. Your y-intercept is where your line crosses the y-axis.
Y=m+b
To find your equation of a trend line, follow these steps.
Step 1: Draw your trend line.
You begin by drawing your trend line. You want your trend line to follow your data. You want to have roughly half your data above the line and the other half below the line like this.
Step 2: Locate two points on the line.
Your next step is to locate two points on the trend line. Look carefully at your trend line and look for two easy to figure out points on the line. Ideally, these are points where the trend line crosses a clearly identifiable location.
For the trend line that we just drew, we can see these two easily identifiable points.
kkk
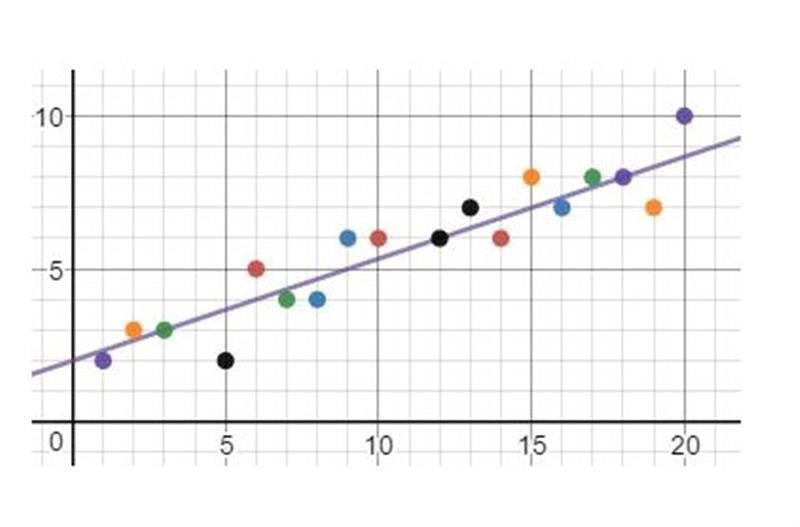
We can easily identify these two points as (3, 3) and (12, 6).